Does Run Differential Guarantee a Winning Record in MLB?
If you watch enough baseball, you've heard something like this:
"This team has a +80 run differential but they're underperforming in the standings. They're due for a surge."
Run differential — runs scored minus runs allowed. In baseball, it's often considered a team's "true talent" indicator. But is it really?
Does a bigger run differential actually mean a higher winning percentage?
I checked with 2025 MLB data for all 30 teams.
The 30-Team Standings
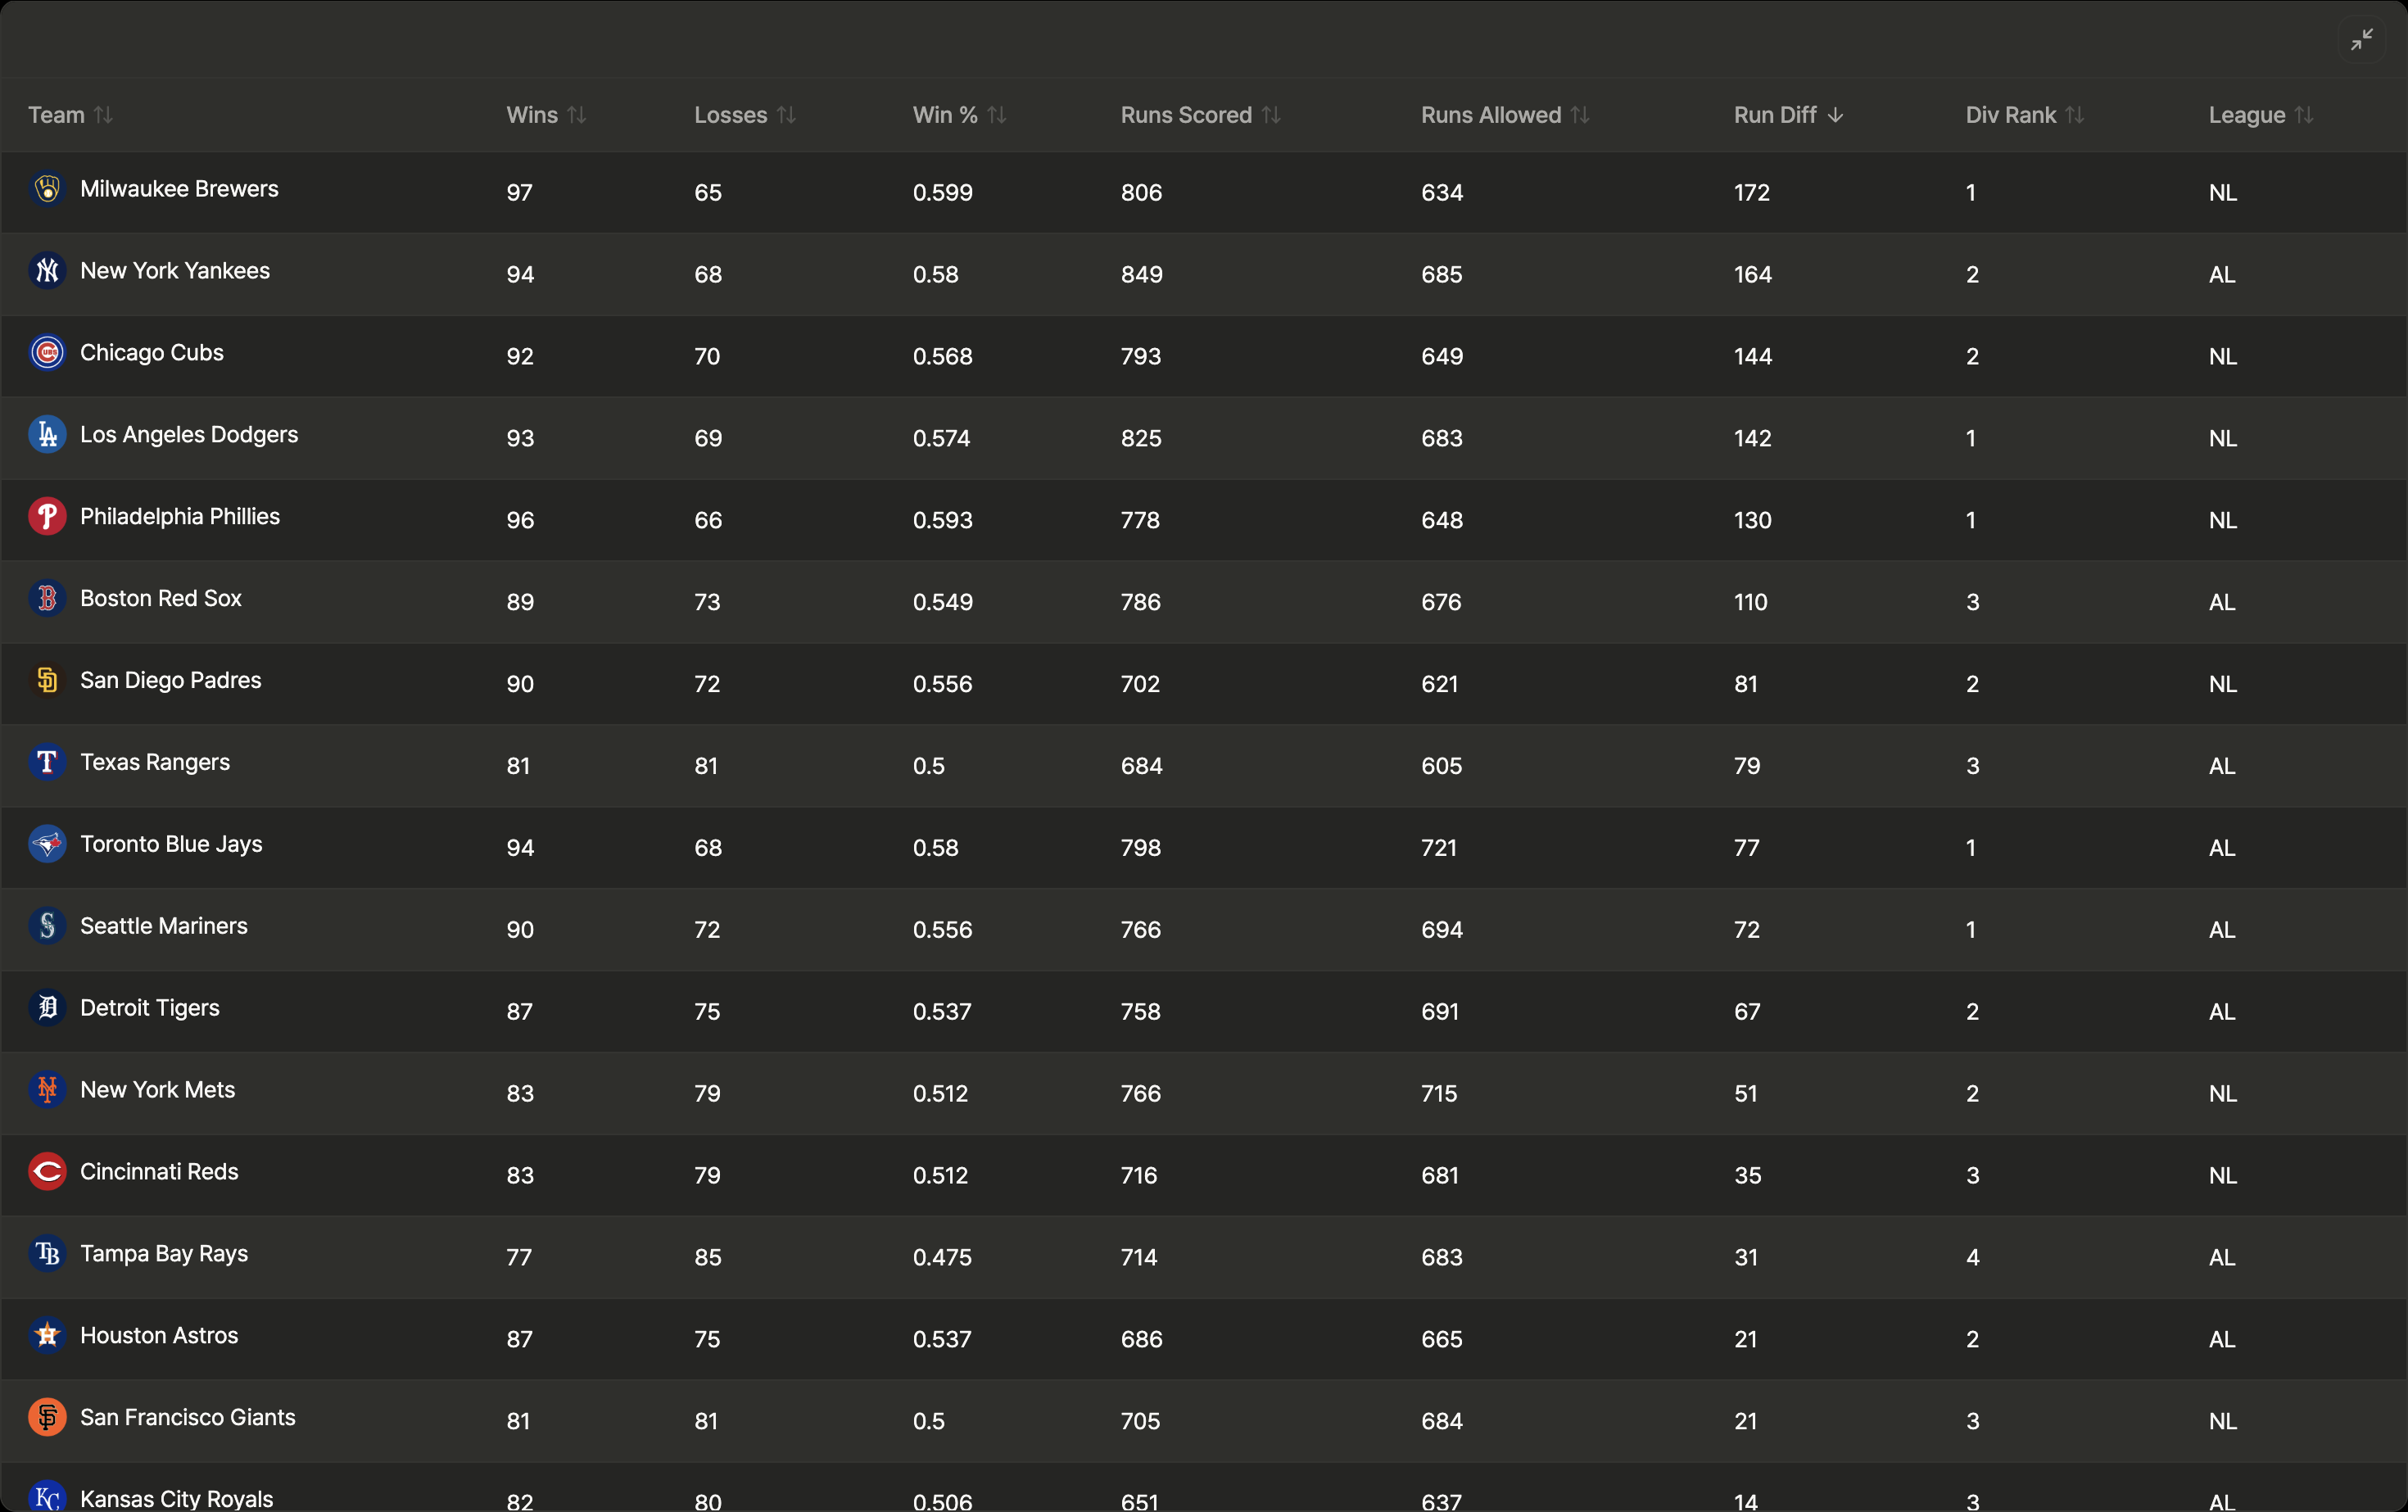
You can see wins, losses, winning percentage, runs scored, runs allowed, and run differential for all 30 teams. Some teams are above +100, others below -100.
But just looking at a table of numbers doesn't make the relationship between run differential and winning percentage obvious.
A Scatter Plot Makes It Clear
To see how two numbers relate, a scatter plot is the right tool.
- X-axis: Run Differential
- Y-axis: Winning Percentage
- Each dot = one team
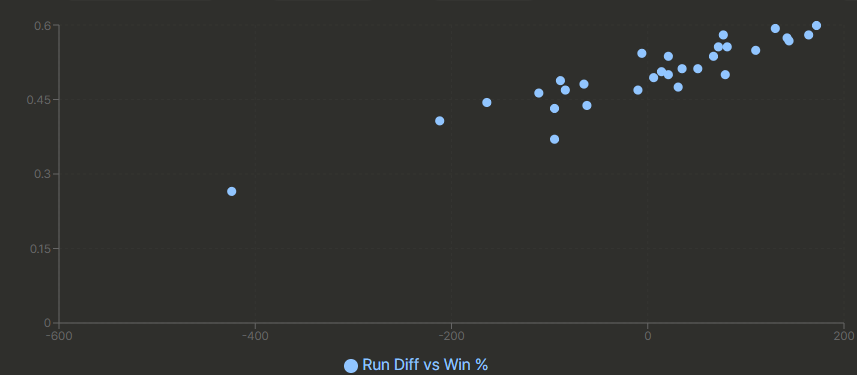
The dots flow from bottom-left to top-right.
- Top-right = high run differential, high winning percentage
- Bottom-left = low run differential, low winning percentage
The relationship is clear. Bigger run differential, higher winning percentage.
Any Outliers?
Most teams sit neatly on the trend line, but a few stand out.
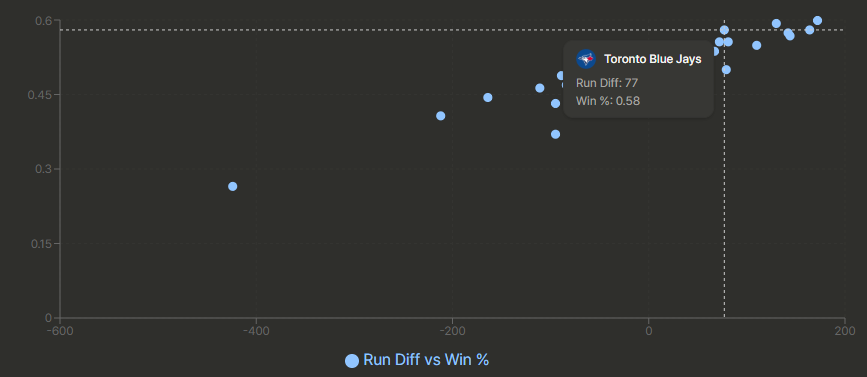
- High win% despite modest run differential — a team that wins close games consistently?
- Low win% despite strong run differential — wins big but loses close?
Why these teams deviate from expectations is a question worth digging into.
So, What's the Verdict?
Even from the scatter plot alone, it's clear: run differential and winning percentage are strongly related.
But "clearly related" is just a visual impression. Can we express how strong this relationship is with a single number?
→ In the next post, I'll measure it with something called the correlation coefficient.
This analysis was done with just-mlb, a tool I built. Want to play with the scatter plot yourself? Check it out.